
Day 62 of 100 Days Of Code
Day 62: September 24, Monday
Today ‘s Progress: Continued lessons on Introduction to the Data Visualization with D3 Challenges.
Thoughts: Continued the D3.js lessons and Challenges, confirmed there is some content missing from #freeCodeCamp The examples that are there are pretty good some are not needed.
Resources used:
- JSFiddle
- REPL.IT
- GitHub_FCC_Repo
- D3: setting style conditionally with immediately invoked arrow function and ternary
- D3 Tutorial
- D3 in Depth
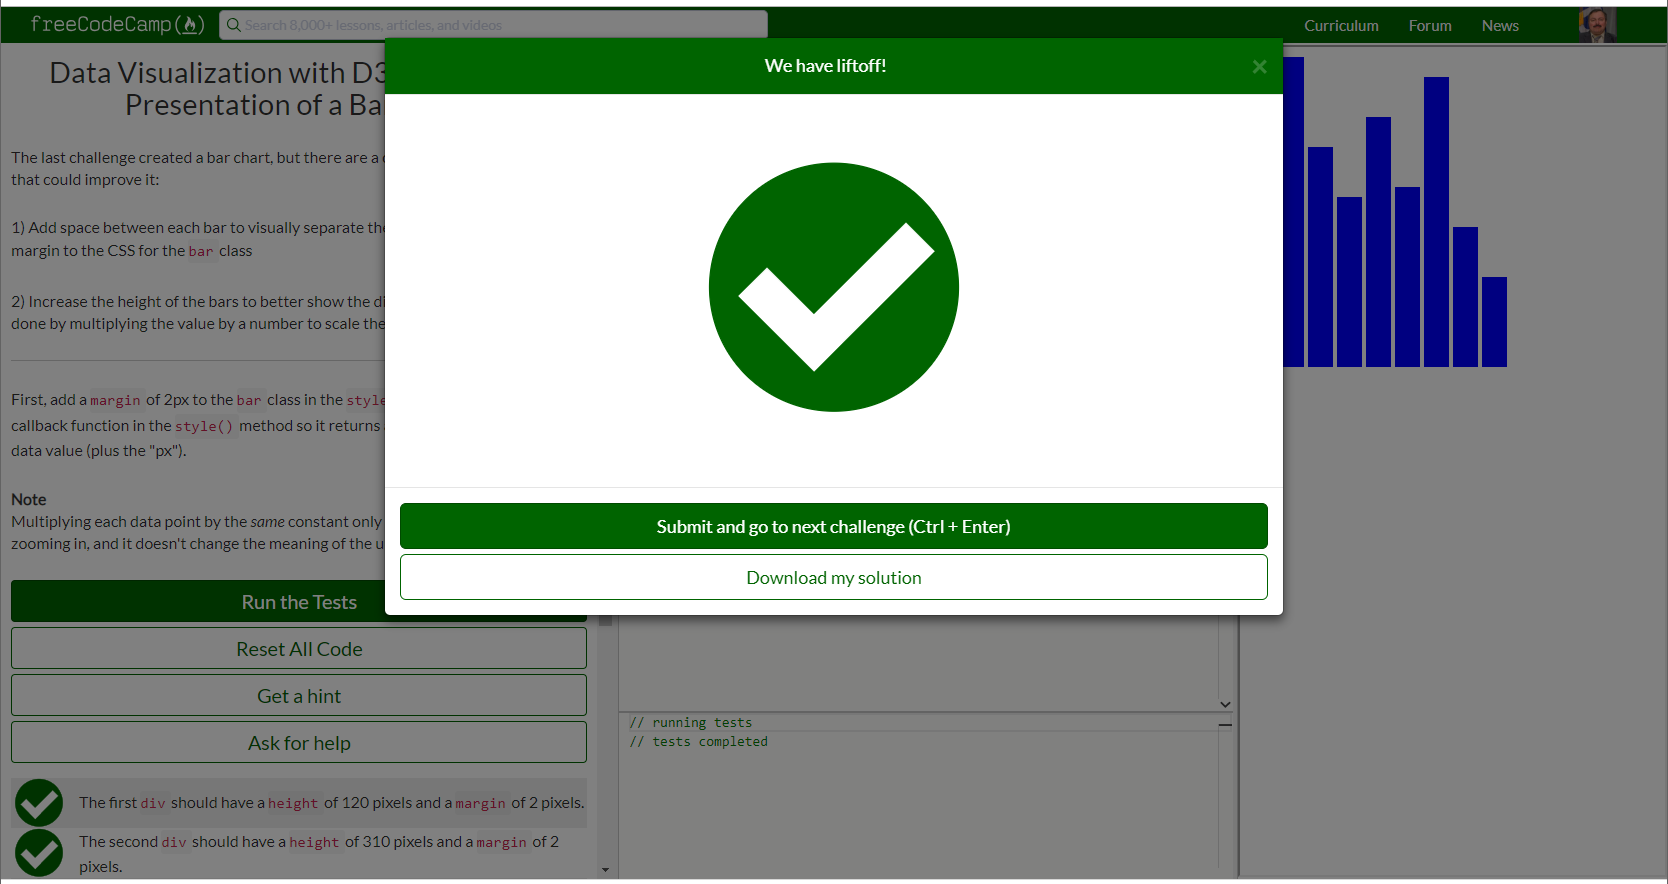
Change the Presentation of a Bar Chart (Last challenge I did) Example: none
Challenge Instructions: First, add a margin of 2px to the bar class in the style tag. Next, change the callback function in the style() method so it returns a value 10 times the original data value (plus the “px”).
Note: Multiplying each data point by the same constant only alters the scale. It’s like zooming in, and it doesn’t change the meaning of the underlying data.
My solution
<style>
  .bar {
    width: 25px;
    height: 100px;
    /* Add your code below this line */
    margin: 2px;
    /* Add your code above this line */
    display: inline-block;
    background-color: blue;
  }
</style>
<body>
  <script>
    const dataset = [12, 31, 22, 17, 25, 18, 29, 14, 9];
    d3.select("body").selectAll("div")
      .data(dataset)
      .enter()
      .append("div")
      .attr("class", "bar")
      // Add your code below this line
      .style("height", (d) => (d * 10 + "px"));
      // Add your code above this line
  </script>
</body>
Link(s) to work
- Started work on Introduction to the Data Visualization with D3 Challenges.
Introduction to the Data Visualization with D3 Challenges
- Add Document Elements with D3
- Select a Group of Elements with D3
- Work with Data in D3
- Work with Dynamic Data in D3
- Add Inline Styling to Elements
- Change Styles Based on Data
- Add Classes with D3
- Update the Height of an Element Dynamically
- Change the Presentation of a Bar Chart All code is in GitHub FCC_Challenges/DataVisualizationWithD3.md.